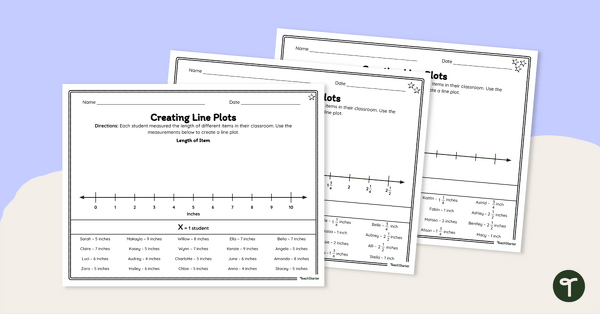
Use this fun and engaging interactive activity to aid students. in practicing their pictograph interpretation skills.
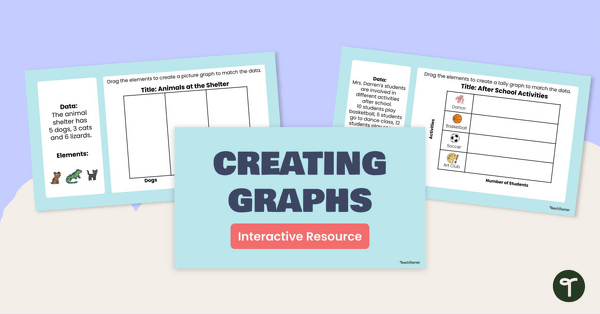
🍋 🍊 Pictographs Interactive Activity 🍋 🍊
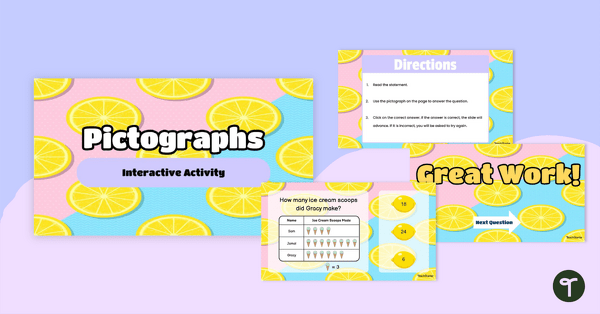
Use this fun, summer foods-themed interactive activity to practice reading and interpreting pictographs with your students! To play:
- Read the statement.
- Use the pictograph on the page to answer the question.
- Click on the correct answer. If the answer is correct, the slide will advance. If it is incorrect, you will be asked to try again.
Included in this bright and engaging resource are 24 self-checking task cards in digital format. Simply attach in Google Classroom or Microsoft Powerpoint and have students work their way through the activity independently, or project onto your smartboard and use as a fun class game or warm-up for your math lesson about graphing!
Tips for Differentiation + Scaffolding
A team of dedicated, experienced educators created this resource to support your graphs and data lessons.
In addition to individual student work time, use this activity to enhance learning through math groups, whole class lessons, or remote learning assignments.
If you have a mixture of above and below-level learners and ELL/ESL students, we have a few suggestions for keeping students on track with these concepts:
🆘 Support Struggling Students
Provide students with physical manipulatives to move and count, in order to practice 1-1 correspondence, before moving them on to scaled intervals (many-to-one representations).
➕ Challenge Fast Finishers
Have students create their own pictograph of a survey they conduct among their peers!
🧑🏫 Group Learning
Project the slides onto a screen and work through them as a class by having students record their answers in their notebooks or mini whiteboards.
Plan lessons for all ability levels with our 10 Best Scaffolding Strategies!
Easily Prepare This Resource for Your Students
Use the dropdown icon on the Download button to choose between the PowerPoint, Google Slides, or PDF versions of this resource.
Assign this interactive activity in Google Classroom or Microsoft Suite (PPT). Please be sure to open in Edit mode, not Presentation mode. Students click/drag/drop to answer the questions.
More Ways to Use This Pictographs Interactive Activity
In addition, print off slides and use them as:
- math center or guided group
- lesson exit ticket
- fast finisher activity
- homework assignment
- whole-class review (via smartboard)
This resource was created by Cassandra Friesen, a teacher in Colorado and Teach Starter Collaborator.
Don’t stop there! We’ve got more activities and resources that cut down on lesson planning time:
teaching resource
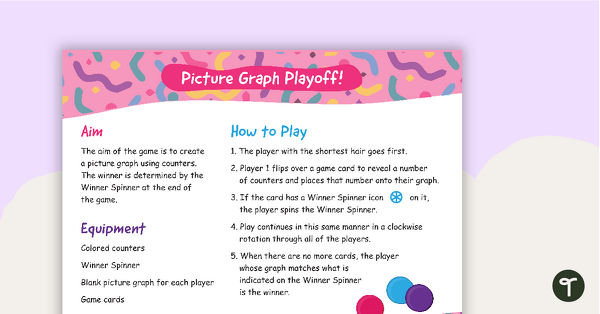
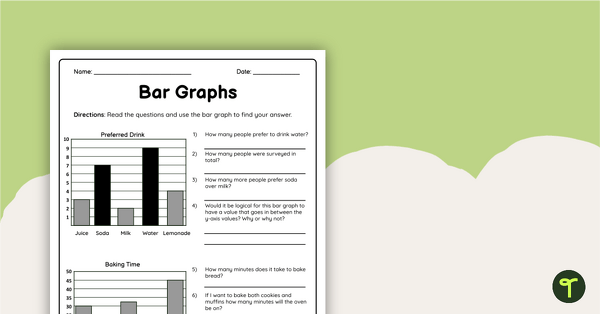
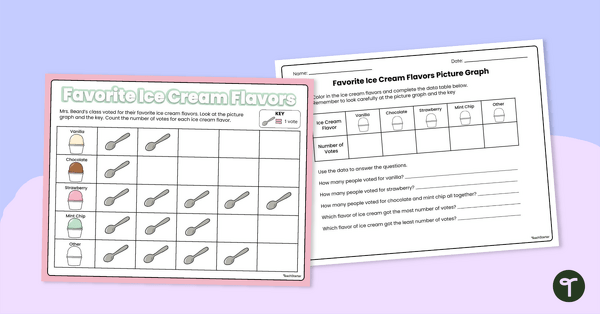
Picture Graph Playoff – Math Game
A fun game for students to practice gathering and representing data in a picture graph.
teaching resource
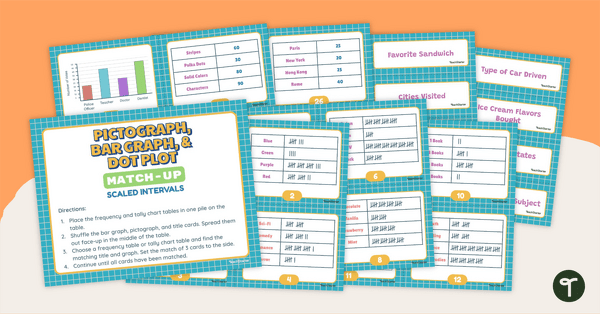
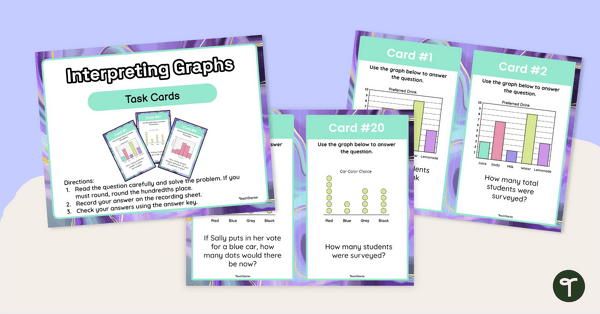
Pictograph, Bar Graph, & Dot Plot Match-Up (Scaled Intervals)
Use data analysis skills to match tally charts and frequency tables with their corresponding bar graph, pictograph, or dot plot.
teaching resource
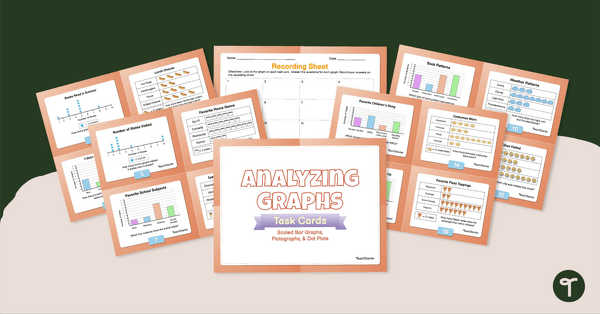
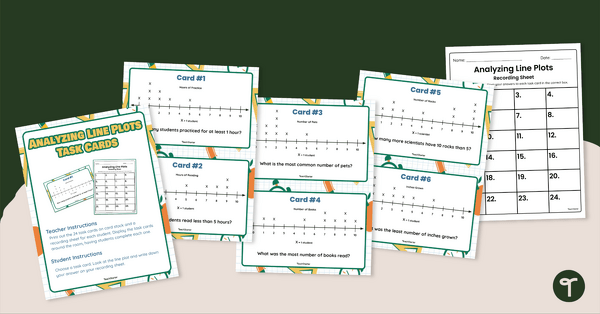
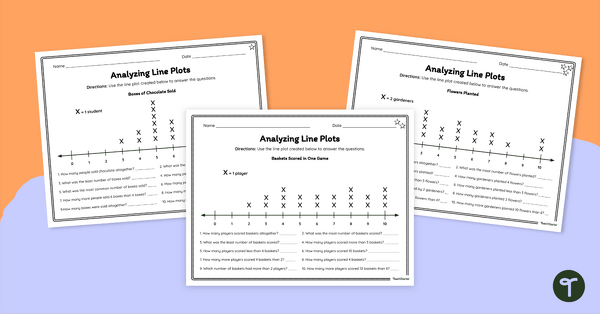
Analyzing Graphs — Scaled Bar Graphs, Pictographs, & Dot Plots —Task Cards
Use data analysis skills to analyze scaled bar graphs, pictographs, and dot plots with this set of task cards.

0 Comments
Write a review to help other teachers and parents like yourself. If you'd like to request a change to this resource, or report an error, select the corresponding tab above.