Guide your students to create line plots with whole-number or ¼ inch measurements with this differentiated line plot worksheet.
What Are Line Plots?
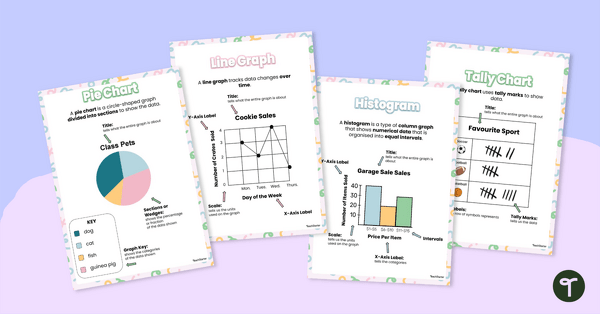
As soon as students enter school, they begin to learn about different ways to organize and represent data. They learn how to show information with bar graphs, pictographs, dot plots, and more. Another type of graph students will encounter is a line plot. If you are looking for an easy way to explain this type of data representation to your students, read on!
A line plot is like a picture that shows how many times different things happen. It uses a line with little “X” marks to show the numbers. For example, if students ask their friends about their favorite fruits and get the answers, we can make a line plot to see which fruit is the most popular. Each “X” on the line plot represents one student who likes that fruit. It helps us understand the data in a fun and easy way!
Working With Line Plots in 2nd and 3rd Grade
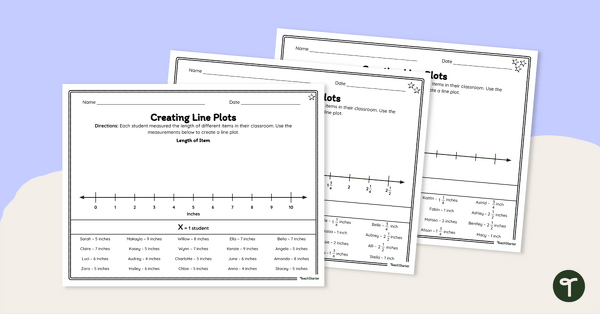
As students work with line plots in their elementary years, they will learn to represent the measurements of different objects in this type of graph. After collecting the data, students will then be able to plot an “X” above its corresponding value and determine how many objects were recorded for each length. In 2nd grade, these values are whole number lengths, and 3rd graders begin to work with ¼ inch increments.
What’s Included?
Teach Starter has created a differentiated worksheet for your students to practice creating a line plot. Each version (as noted with 1, 2 or 3 stars in the upper right corner) will give your students the practice they need.
- One Star – whole numbers
- Two Stars – ¼ inch increments with a labeled number line
- Three Stars – ¼ inch increments with an unlabeled number line
An answer key is included with your download to make grading fast and easy!
Differentiation + Scaffolding Tips
In addition to independent student work time, use this worksheet as an activity for:
- Whole-class activity (via smartboard)
- Homework activity
- Assessment
For students that need a bit of a challenge, encourage them to create 3-5 questions based on the line plot they created. Students can then trade with a classmate if they wish. Additionally, provide students the level 3 version of the worksheet.
If there are students in need of support, provide them with the 1-star version of this worksheet. Encourage students to cross off each data point as they place it on the line plot.
Easily Download & Print Your Line Plot Worksheets
Use the dropdown icon on the Download button to choose between the PDF or editable Google Slides version of this resource.
Because this resource includes an answer sheet, we recommend you print one copy of the entire file. Then, make photocopies of the blank worksheet for students to complete.
Turn this teaching resource into a sustainable activity by printing on cardstock and slipping it into a dry-erase sleeve. Students can record their answers with a whiteboard marker, then erase and reuse them.
This resource was created by Brittany Kellogg, a teacher in Ohio and a Teach Starter Collaborator.
Don’t stop there! We’ve got more activities to shorten your lesson planning time:
teaching resource
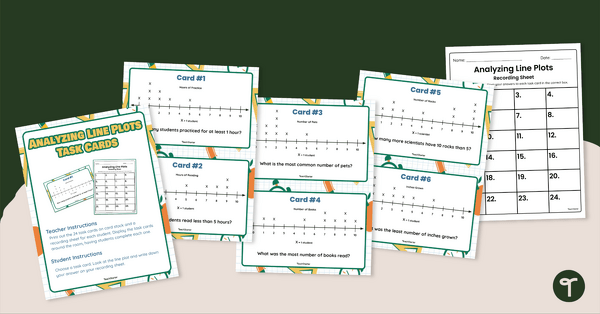
Analyzing Line Plots Task Cards
Strengthen data analysis skills by interpreting line plots with this set of 24 task cards.
teaching resource
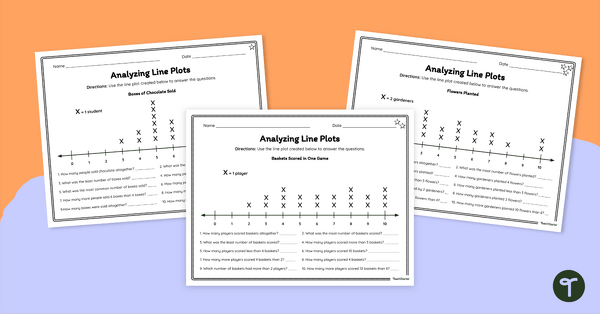
Analyzing Line Plots – Differentiated Worksheets
Empower your students to become proficient data interpreters with this set of differentiated line plot worksheets.
teaching resource
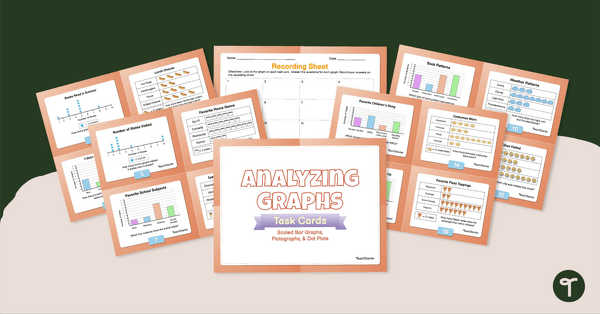
Analyzing Graphs — Scaled Bar Graphs, Pictographs, & Dot Plots —Task Cards
Use data analysis skills to analyze scaled bar graphs, pictographs, and dot plots with this set of task cards.


0 Comments
Write a review to help other teachers and parents like yourself. If you'd like to request a change to this resource, or report an error, select the corresponding tab above.