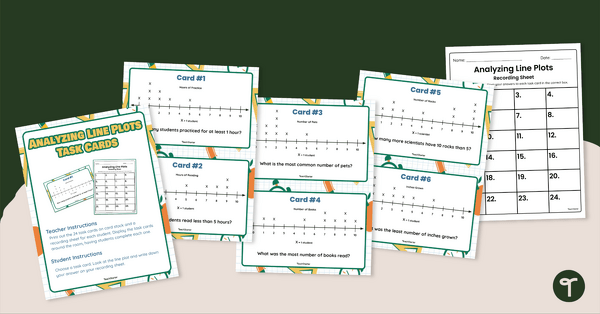
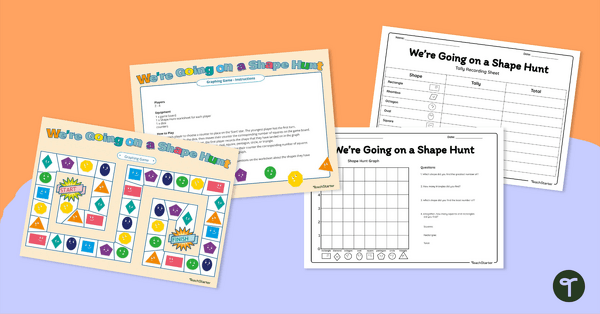
Strengthen data analysis skills by interpreting line plots with this set of 24 task cards.
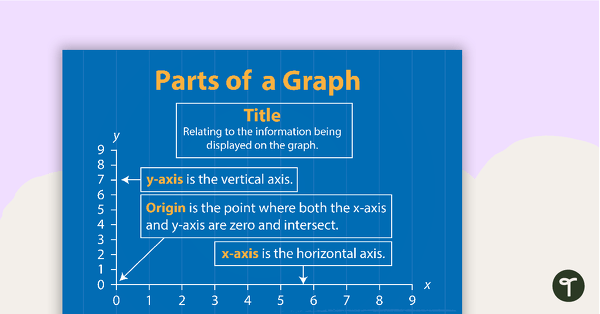
What Is a Line Plot?
Is this a question your students have been asking you in your math class? As students begin to dive into their study of charts and data, there are many different ways to display information. Let’s take a look at an easy way to explain line plots to your students.
A line plot is a simple and effective way to represent data along a number line visually. It is a type of graph that displays individual data points as X’s above their corresponding values on the number line. If your students have been studying dot plots, this type of graph is very similar. Your students may just be using dots to represent data rather than Xs.
Line Plot Questions for 2nd and 3rd Grade
Are you looking for a resource to empower your students with proficiency in interpreting line plots? This downloadable resource consists of 24 engaging and thought-provoking task cards designed to challenge and inspire learners while reinforcing their data analysis skills.
📈 Wide Coverage: With 24 task cards, students will encounter a diverse range of line plots, each presenting unique datasets and scenarios. This variety ensures comprehensive coverage of different data representations.
📊 Differentiated Difficulty: To cater to various learning levels, 18 of the task cards utilize single-unit intervals, providing a solid foundation for understanding line plots. Additionally, 6 cards feature scaled intervals, offering an extra challenge for advanced learners.
✍️ Recording Sheet: To facilitate seamless organization, a dedicated recording sheet is provided. Students can jot down their answers alongside each task, allowing for easy review and assessment by educators.
Tips for Differentiation + Scaffolding
A team of dedicated, experienced educators created this resource to support your math lessons.
In addition to individual student work time, use this set of task cards to enhance learning through guided math groups, whole class lessons or remote learning assignments.
If you have a mixture of above and below-level learners, check out these suggestions for keeping students on track with the concepts:
🆘 Support Struggling Students
Help students who need help understanding the concepts by allowing them to complete the questions with the help of a peer. Additionally, students can be required only to complete some of the cards.
➕ Challenge Fast Finishers
For students who need an additional challenge, encourage them to represent the same data in a different way. This may be by a dot plot, bar graph, or pictograph.
🖼️ Gallery Walk (Scoot Activity)
Hang all task cards around the room. Assign students or pairs to a task card to start, and have them take notes about the card on a sheet of paper. When you say “Scoot,” students will rotate through the cards until they have completed each one. Lead the class in a discussion, or divide students into groups to share the information they collected and the evidence they examined.
🔔 Bell Ringer Activity
Project a card for your students to see as soon as they enter the classroom. On a piece of paper or in their notebooks, have students answer the question about the displayed line plot. Students can also come up with additional questions about the graph and trade them with a classmate. Collect the papers or discuss the answers as a group.
Easily Prepare This Resource for Your Students
Use the dropdown icon on the Download button to choose between the PDF or editable Google Slides version of this resource. A recording sheet and answer key are also included with this download.
Print on cardstock for added durability and longevity. Place all pieces in a folder or large envelope for easy access.
This resource was created by Brittany Kellogg, a teacher in Ohio and a Teach Starter Collaborator.
Don’t stop there! We’ve got more activities and resources that cut down on lesson planning time:
teaching resource
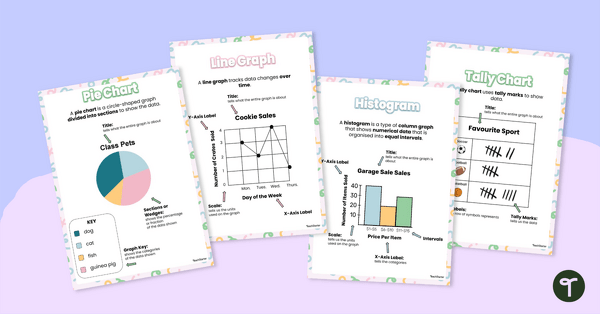
Types of Graphs Posters
This colorful and easy-to-digest visual display shows students the varying data displays they will encounter in their elementary math lessons.
teaching resource
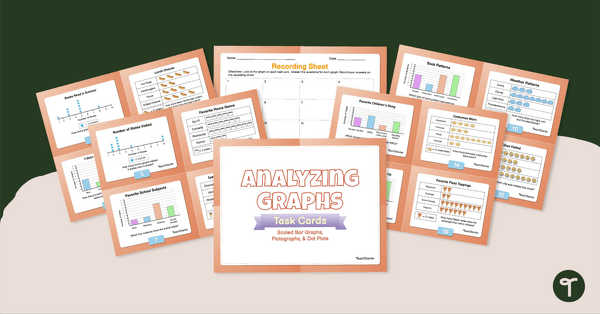
Analyzing Graphs — Scaled Bar Graphs, Pictographs, & Dot Plots —Task Cards
Use data analysis skills to analyze scaled bar graphs, pictographs, and dot plots with this set of task cards.
teaching resource
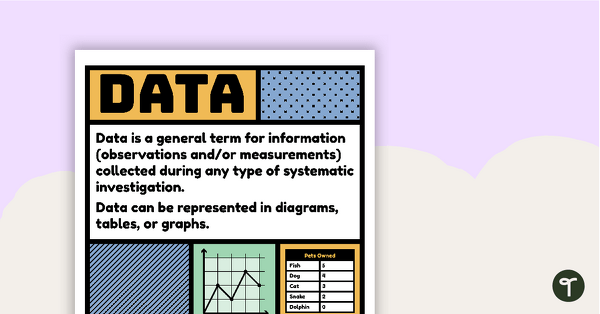
Data Vocabulary Poster
A poster that explains the concept of data and lists associated vocabulary.


0 Comments
Write a review to help other teachers and parents like yourself. If you'd like to request a change to this resource, or report an error, select the corresponding tab above.