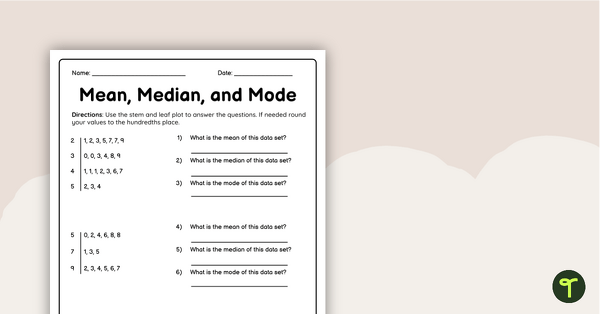
Use this double-sided worksheet to check students’ ability to find the mean, median and mode of given data sets.
Introduction to Statistics and Data
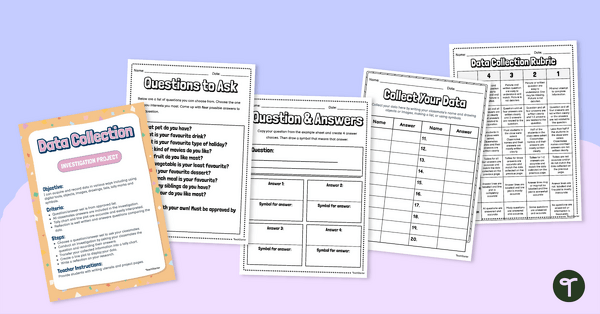
If you’ve been teaching your elementary or middle school students about data sets, you may be looking for a worksheet to help them practise finding mean, median and mode in data.
This two-sided worksheet contains various stem-and-leaf plot and dot plot data representations with corresponding questions for students to solve. It also contains an answer key to make marking quick and easy!
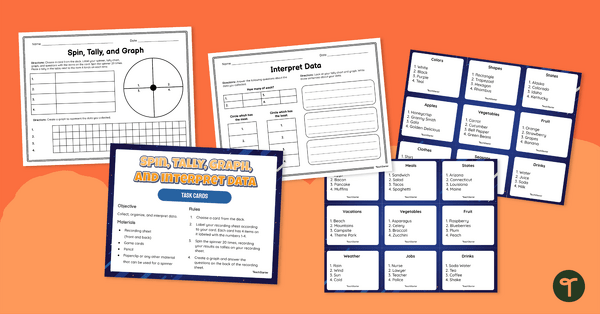
Use this collection of task card to allow students to practise finding the mean, median, and mode of small sets of data, in the form of stem-and-leaf plots and numerical lists.
Tips for Differentiation + Scaffolding
A team of dedicated, experienced educators created this worksheet to support your data and statistics lessons.
In addition to individual student work time, use this worksheet to enhance learning through small math groups or whole class lessons.
If you have a mixture of above and below-level learners, check out these suggestions for keeping students on track with the concepts:
🆘 Support Struggling Students
Display this Mean, Median and Mode Range poster set to provide a reminder of the definitions of each.
➕ Challenge Fast Finishers
Edit the resource in Google Slides to extend above-level learners by creating larger or more complex data sets for them to sort.
Easily Prepare This Resource for Your Students
Use the dropdown icon on the Download button to choose between the PDF or Google Slides version of this resource.
Print on cardboard for added durability and longevity. Place all pieces in a folder or large envelope for easy access.
To keep the task cards out of pockets or under desks, punch a hole in the corner of each to place them on a binder ring.
Sustainability Tip: Print a few recording sheets on cardboard and slip them into write-and-wipe sleeves. Students can record their answers with a whiteboard marker, then erase and reuse them.
This resource was created by Cassandra Friesen, a teacher in Colorado and Teach Starter Collaborator.
Don’t stop there! We’ve got more activities and resources that cut down on lesson planning time:
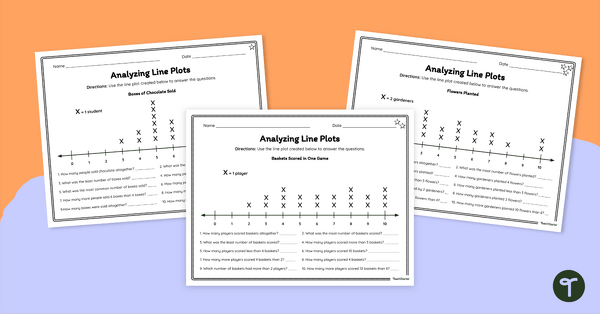
Use this set of task cards students to practice interpreting bar graphs, histograms and line plots. Empower your students to become proficient data interpreters with this set of differentiated line plot worksheets.
teaching resource
Interpreting Graphs Task Cards
teaching resource
Analyzing Line Plots – Differentiated Worksheets


0 Comments
Write a review to help other teachers and parents like yourself. If you'd like to request a change to this resource, or report an error, select the corresponding tab above.