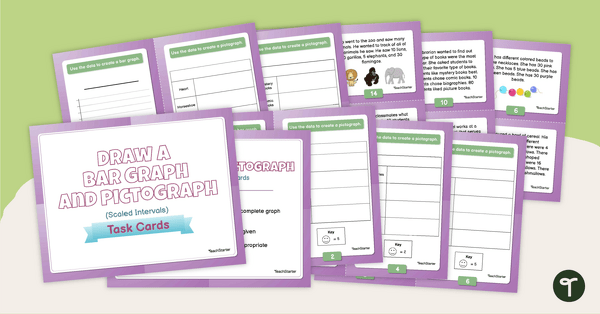
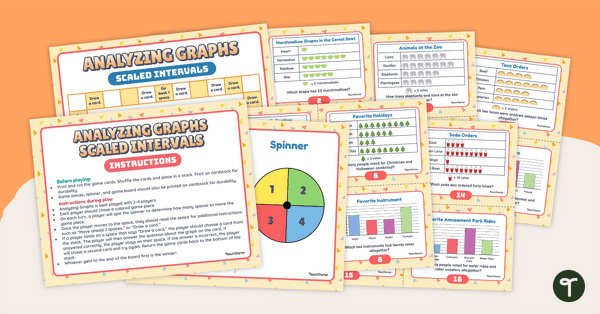
Practice drawing scaled bar graphs and pictographs with this set of task cards.
📊 Draw Scaled Bar Graphs and Pictographs
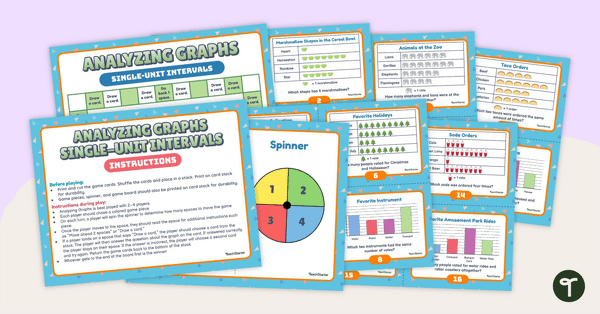
How do we teach students to represent data? There are so many different types of graphs and ways to display information. As students dive deeper into analyzing data, bar graphs and pictographs are typically covered first. While your students may have some experience interpreting single-unit bar graphs and pictographs, this resource will give your students practice with scaled intervals.
So… what does “scaled intervals” mean exactly? This is just a fancy way of saying the pictures in a pictograph and the vertical lines in a bar graph increase by numbers other than 1. It may be that the graphs use increments of 2, 5, or 10.
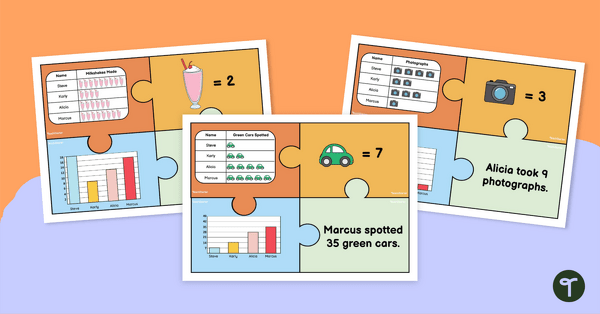
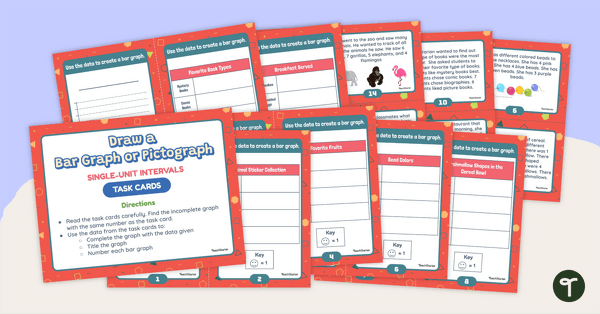
To complete this activity, read the task cards carefully. Find the incomplete graph with the same number as the task card. Use the data from the task cards to:
- Complete the graph with the data given
- Title the graph
- Number each bar graph with an appropriately scaled interval
Through this activity, students will show they can draw a scaled picture graph and a scaled bar graph to represent a data set with several categories.
Tips for Differentiation + Scaffolding
A team of dedicated, experienced educators created this resource to support your math lessons.
In addition to individual student work time, use this data analysis activity to enhance learning through guided math groups, whole class lessons, or remote learning assignments.
If you have a mixture of above and below-level learners, check out these suggestions for keeping students on track with the concepts:
🆘 Support Struggling Students
Help students who need support by using the single-unit interval version of this resource. Additionally, students can complete this activity in a 1-on-1 setting or with a small group of students.
➕ Challenge Fast Finishers
For students who need a bit of a challenge, challenge them to create a scaled dot plot to display the same information.
🛴 Scoot Activity
Place the cards around the room in numerical order and give each student a recording sheet. Assign students or pairs to a starting point card. Give students time to review the card and draw a bar graph or pictograph on their paper. Students will rotate to the next card when you say, “SCOOT!” Continue in this manner until students return to their starting point.
👋 Exit Ticket
Use these cards as a formative assessment after your lesson. Pick a random assortment of cards and project them on the board for the whole class to see. Students can record their answers on a sheet of paper, sticky note, or their notebook.
Plan lessons for all ability levels with our 10 Best Scaffolding Strategies!
Easily Prepare This Resource for Your Students
Use the dropdown icon on the Download button to choose between the color PDF, black and white PDF, or editable Google Slides version of this resource.
Print on cardstock for added durability and longevity. Place all pieces in a folder or large envelope for easy access.
To keep the task cards out of pockets or under desks, punch a hole in the corner of each to place them on a binder ring.
Sustainability Tip: Print the blank graph cards on cardstock and slip them into dry-erase sleeves. Students can record their answers with a whiteboard marker, then erase and reuse them.
This resource was created by Allie Kleijnjans, a teacher in Pennsylvania and Teach Starter Collaborator.
Don’t stop there! We’ve got more activities and resources that cut down on lesson planning time:
[resource:4841396] [resource:4840833] [resource:4842744]

0 Comments
Write a review to help other teachers and parents like yourself. If you'd like to request a change to this resource, or report an error, select the corresponding tab above.