Year 4
The proficiency strands understanding, fluency, problem-solving and reasoning are an integral part of mathematics content across the three content strands: number and algebra, measurement and geometry, and statistics and probability. The proficiencies reinforce the significance of working mathematically within the content and describe how the content is explored or developed. They provide the language to build in the developmental aspects of the learning of mathematics. The achievement standards reflect the content and encompass the proficiencies.
At this year level:
- understanding includes making connections between representations of numbers, partitioning and combining numbers flexibly, extending place value to decimals, using appropriate language to communicate times and describing properties of symmetrical shapes
- fluency includes recalling multiplication tables, communicating sequences of simple fractions, using instruments to measure accurately, creating patterns with shapes and their transformations and collecting and recording data
- problem-solving includes formulating, modelling and recording authentic situations involving operations, comparing large numbers with each other, comparing time durations and using properties of numbers to continue patterns
- reasoning includes using generalising from number properties and results of calculations, deriving strategies for unfamiliar multiplication and division tasks, comparing angles, communicating information using graphical displays and evaluating the appropriateness of different displays.
(source: www.australiancurriculum.edu.au)
Achievement Standard
By the end of Year 4, students choose appropriate strategies for calculations involving multiplication and division. They recognise common equivalent fractions in familiar contexts and make connections between fraction and decimal notations up to two decimal places. Students solve simple purchasing problems. They identify and explain strategies for finding unknown quantities in number sentences. They describe number patterns resulting from multiplication. Students compare areas of regular and irregular shapes using informal units. They solve problems involving time duration. They interpret information contained in maps. Students identify dependent and independent events. They describe different methods for data collection and representation, and evaluate their effectiveness.
Students use the properties of odd and even numbers. They recall multiplication facts to 10 x 10 and related division facts. Students locate familiar fractions on a number line. They continue number sequences involving multiples of single digit numbers. Students use scaled instruments to measure temperatures, lengths, shapes and objects. They convert between units of time. Students create symmetrical shapes and patterns. They classify angles in relation to a right angle. Students list the probabilities of everyday events. They construct data displays from given or collected data.
(source: www.australiancurriculum.edu.au)
- Plus Plan
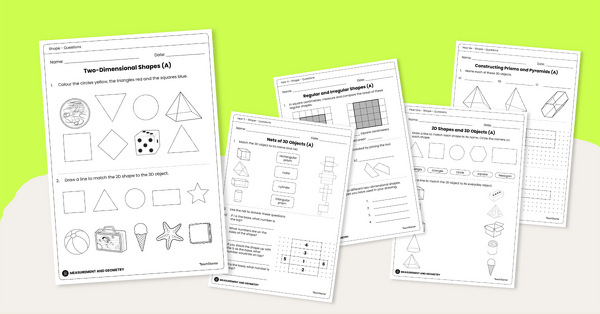
Shape Worksheet Sets (Foundation to Grade 6 Level)
Use these levelled worksheets sets with your primary school students to explore 2D shapes and 3D objects!
- Plus Plan
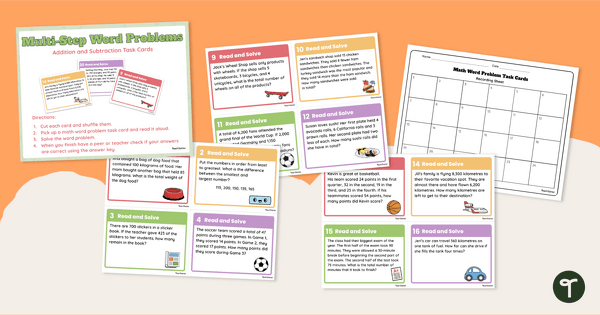
Multi-Step Addition and Subtraction Word Problem Cards – Middle Primary
Solve multi-step addition and subtraction word problems with a set of printable maths task cards.
- Plus Plan
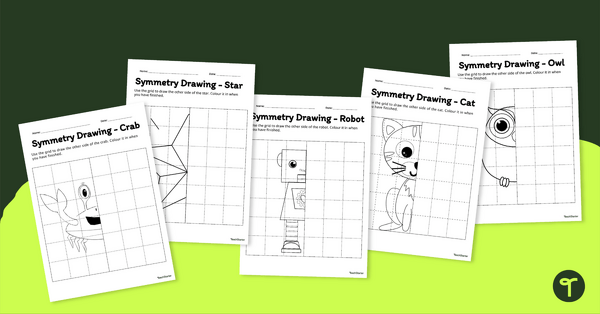
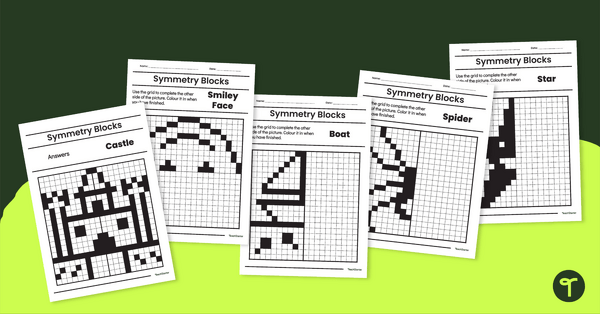
Symmetry Drawing Worksheet Pack
Teach your students about symmetry using this series of drawing worksheets where they must copy an image symmetrically using grid lines for reference.
- Plus Plan
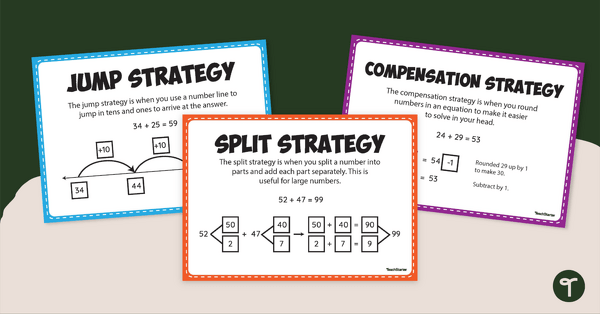
Double-Digit Addition Strategies Posters
Remind your students to use different addition strategies with a set of printable two-digit addition strategies.
- Plus Plan
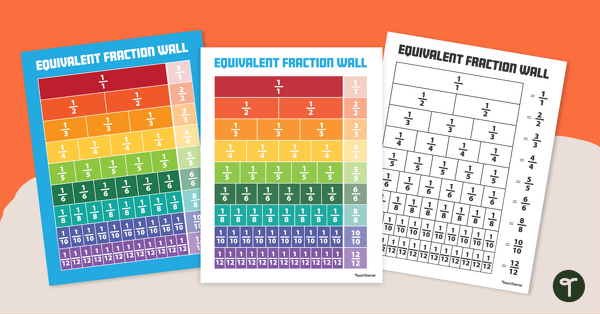
Equivalent Fraction Wall Poster
Guide students to develop an understanding of fractions with the same value by using an equivalent fractions chart in your classroom.
- Free Plan
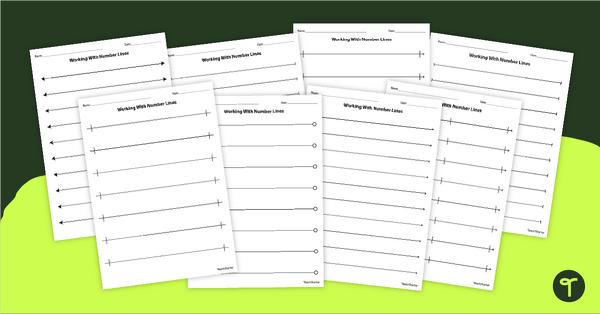
Blank Number Lines - Printable
Print a set of open number lines to help you teach a variety of maths skills.
- Plus Plan
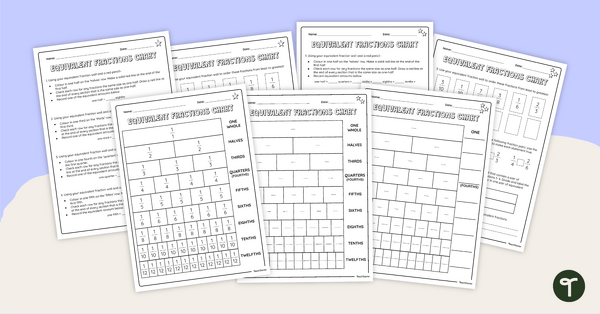
Equivalent Fractions Chart – Differentiated Worksheets
Use a fraction wall to practise finding equivalent fractions and comparing fractions with this set of differentiated worksheets.
- Plus Plan
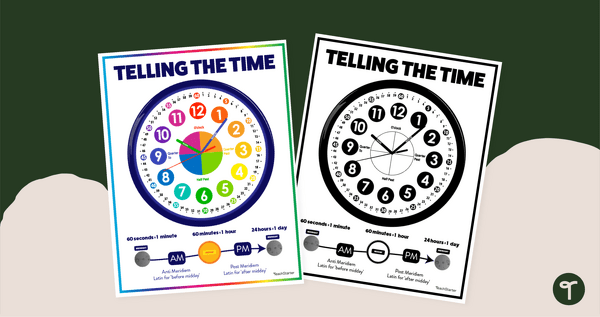
Telling the Time Poster
Help your students learn to tell the time to the hour, half-hour, quarter, and minute with a printable Telling the Time anchor chart PDF.
- Plus Plan
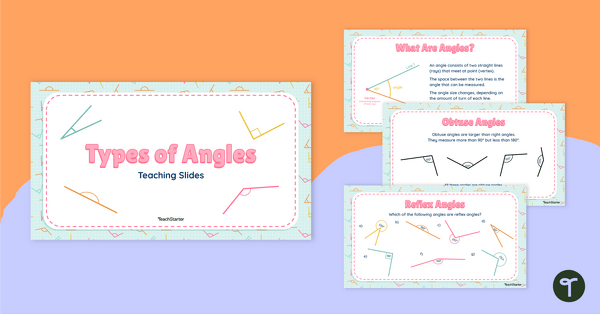
Types of Angles Teaching Slides
Teach your students about the six main angle types with this teaching presentation perfect for primary school maths lessons.
- Plus Plan
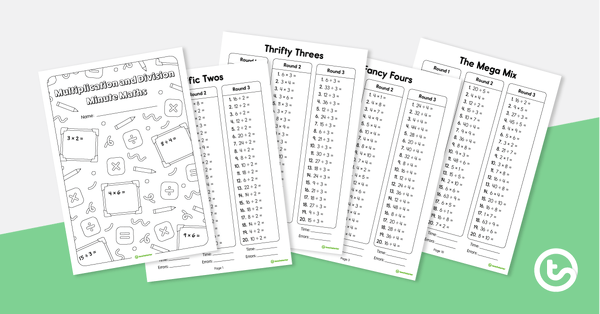
Multiplication and Division Minute Maths Booklet
A maths mentals booklet with ten pages of multiplication and division questions.
- Plus Plan
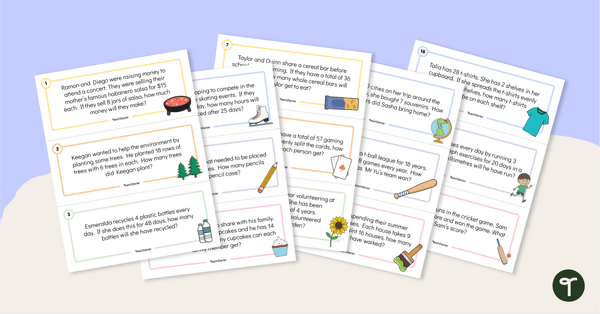
Multiplication and Division Word Problems Task Cards (2-Digit by 1-Digit)
Use a range of strategies to solve 2-digit by 1-digit multiplication and division problems that exceed the facts of the 12 times tables.
- Plus Plan
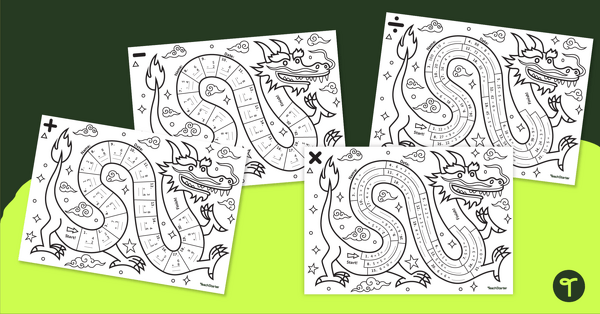
Dominate the Dragon – Mental Maths Worksheets
Capture your students' interest in maths drills for all four operations with these fun dragon-themed differentiated maths worksheets.
- Free Plan
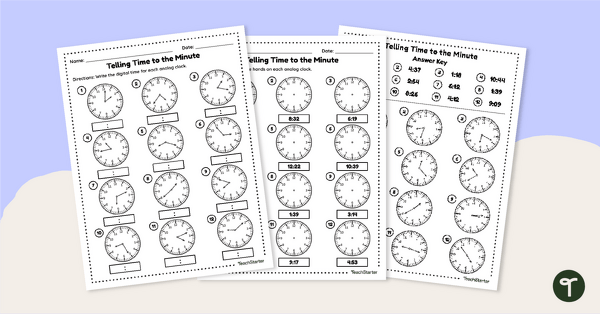
Free Telling Time to the Minute Worksheets
A worksheet for telling time to the minute and converting between analogue and digital times.
- Plus Plan
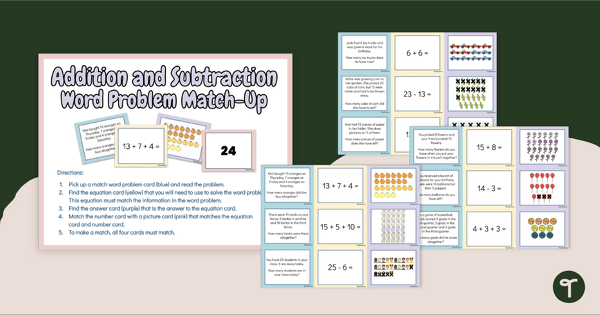
Addition and Subtraction Word Problems - Match Game
Practise reading, modelling, and solving addition and subtraction word problems with a matching activity.
- Free Plan
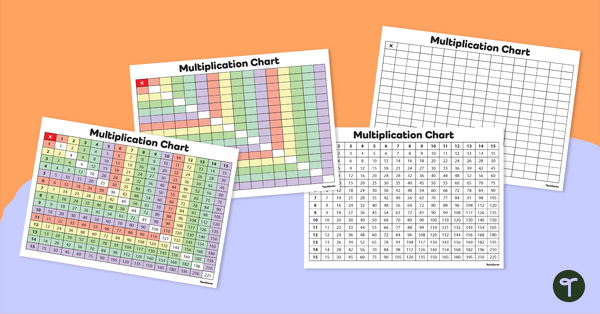
Multiplication Chart
Print a handy multiplication chart for your students — it's free for teachers!
- Plus Plan
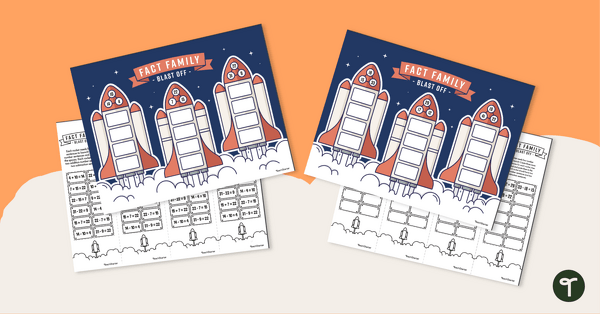
Fact Family Maths Blast Off - Addition and Subtraction
Demonstrate an understanding of addition and subtraction fact families with a fun cut and sort activity.
- Plus Plan
Multiplication Strategies – Classroom Poster Pack
Use this set of posters when teaching different multiplication strategies.
- Plus Plan
Addition and Subtraction Fact Families Teaching Presentation
A 19-page editable teaching presentation to use in the classroom when introducing addition and subtraction fact families.
- Plus Plan
Equivalent Fractions – Teaching Presentation
Teach your students how to find equivalent fractions by using a number line, shaded models or a fraction chart with this teaching presentation.
- Plus Plan
Year 4 Mental Maths Drills Booklet
Jump into your maths lessons with this ten-page maths mentals booklet covering the four operations and number patterns.
- Plus Plan
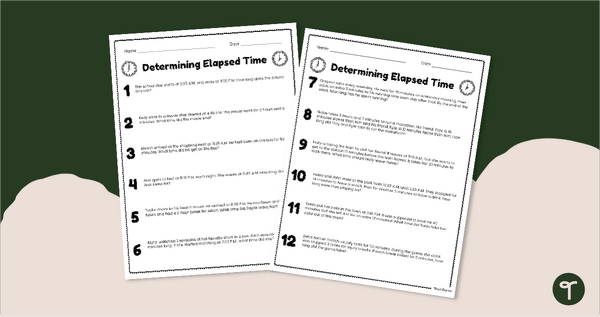
Determining Elapsed Time-Word Problems Worksheet
Print an elapsed time word problems worksheet to provide students with practise measuring the passage of time.
- Plus Plan
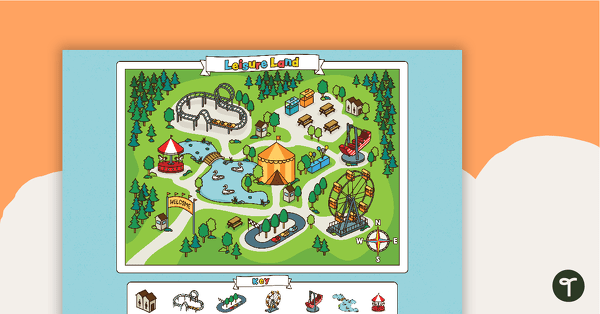
Leisure Land - Map Skills Worksheet
A map and worksheet for students to practice cardinal directions.
- Plus Plan
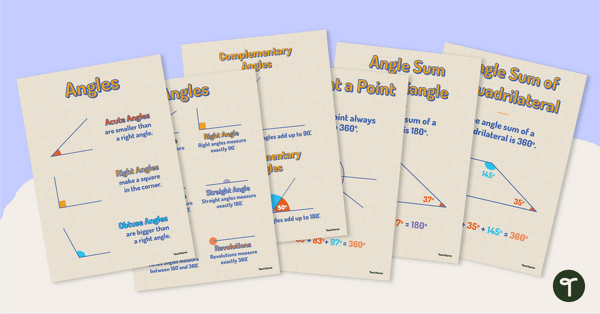
Types of Angles Poster Pack
Remind your students about the most common types of angles with this set of six classroom posters.
- Plus Plan
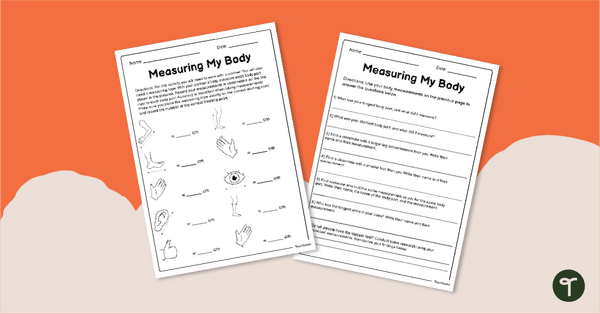
Measuring My Body – Length Worksheet
Explore linear measurement with an engaging collaborative activity where students measure different body parts and compare them.
- Plus Plan
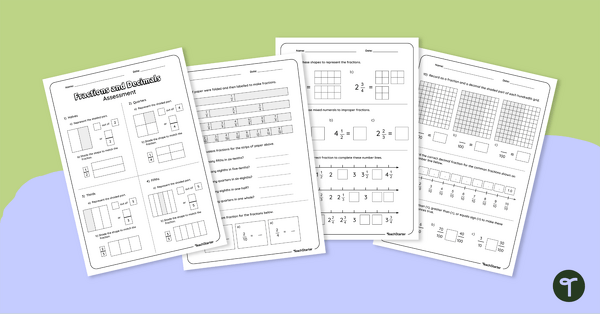
Fractions and Decimals Assessment
Assess students' knowledge of various decimals and percentages concepts with this four-page worksheet.
- Free Plan
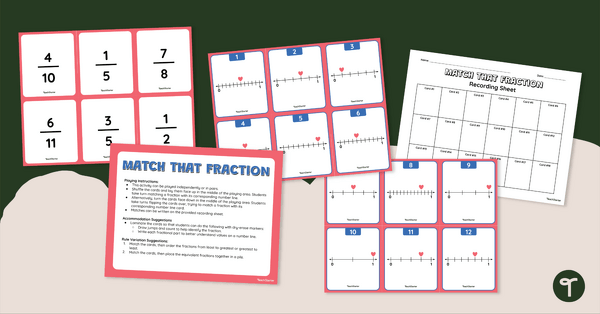
Match That Fraction! – Number Line Activity
Match fractions with their corresponding locations on a number line with a set of fraction task cards.
- Plus Plan
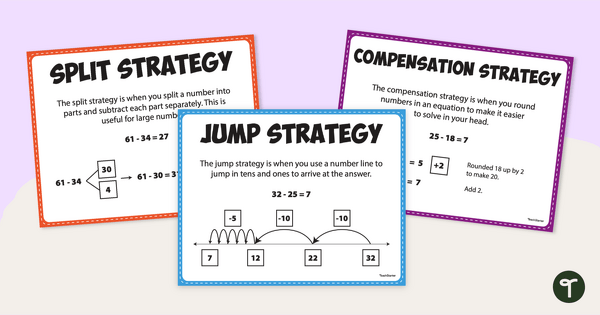
Basic Subtraction Strategies Posters
Remind your students to use different subtraction strategies with a set of printable subtraction anchor charts.
- Plus Plan
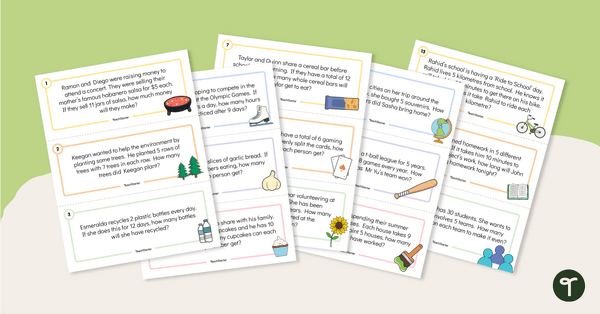
Multiplication and Division Word Problems Task Cards (Facts of 2, 5 and 10)
Use a range of strategies to solve multiplication and division problems with 2, 5 and 10 times tables.
- Plus Plan
Symmetry Worksheets
Use this set of eight symmetry worksheets to help students understand symmetry, the line of symmetry, and symmetrical objects.
- Plus Plan
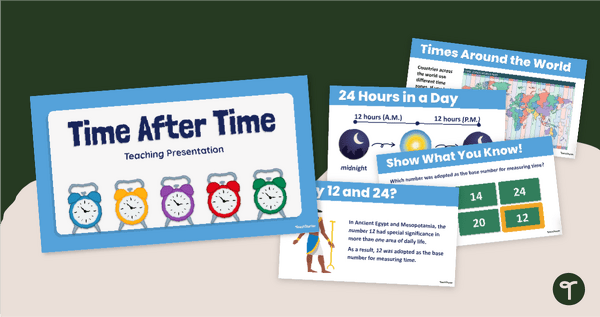
Time After Time Mathematics PowerPoint
Introduce your students to the history of the clock, time zones, and telling time with an interactive teaching presentation.
- Plus Plan
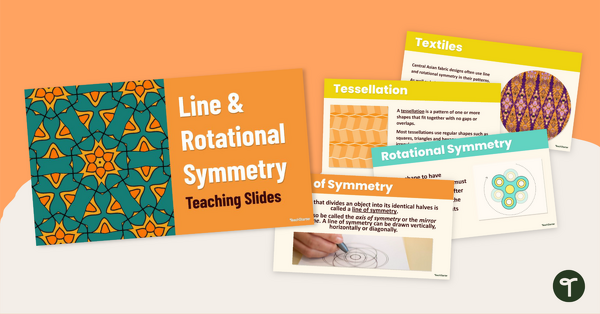
Line and Rotational Symmetry Teaching Slides
Use this comprehensive deck of 20 teaching slides to introduce your Grade 4 students to line symmetry and rotational symmetry.
- Plus Plan
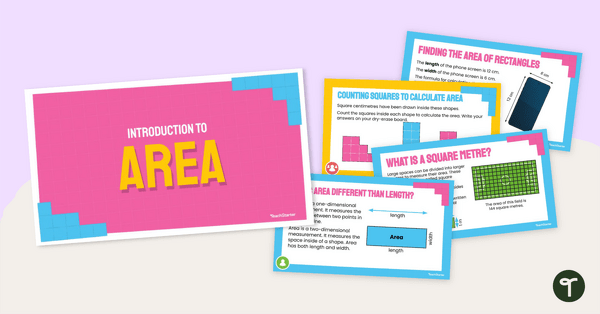
Introduction to Area Teaching Slides
Introduce the concept of measuring the area of regular shapes with this 22-slide instructional slide deck.