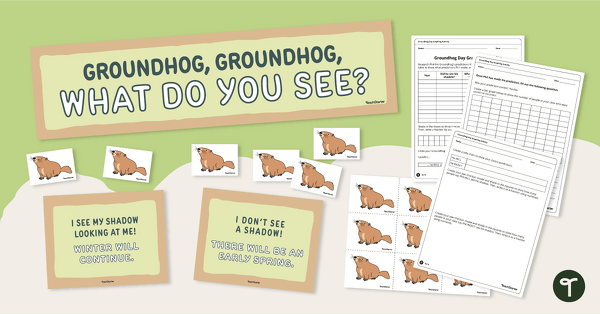
Graph the likelihood that Punxsutawney Phil will see his shadow this year by creating a data chart on our Groundhog Day prediction worksheet.
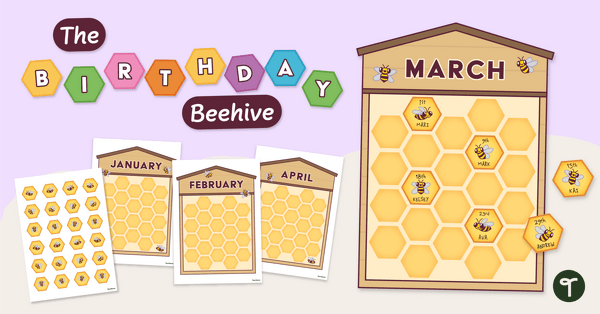
Make Predictions with Our Groundhog Day Graphing Activity
Complete this activity in the weeks leading up to Groundhog Day (February 2).
This classroom resource is a fantastic way to include the whole class in math! Using data analysis to make predictions, students will work together to create a classroom display that graphs the probability that Mr. Groundhog will see his shadow this year. Then, they’ll use the display to answer the questions on the worksheet.
There are multiple ways to complete the predictions display and accompanying worksheet:
Work on the graphing display and worksheet together as a whole class.
- Compile data as an entire class and provide the analysis worksheet as an independent activity.
- Arrange students into groups to complete the research and worksheet together.
Print the groundhogs and banner/cards to create your classroom display. Students will place their groundhog card under their prediction card that matches their findings.
Through completing this activity, students demonstrate an ability to communicate mathematical ideas using graphs, fractions, various charts, and topic-appropriate language to share data.
Scaffolding + Extension Tips
In addition to individual student work time, use this graphing activity as a:
- Math Warm-up
- Guided math group assignment
- Homework assignment
In addition to graphing their classmates’ predictions, students who need more of a challenge can also graph the past predictions of Phil the Groundhog to show his success rate.
Students struggling with the graphing concepts in this activity may benefit from talking through their predictions in a class discussion, small group, or with a partner.
How To Prepare This Resource
Use the dropdown icon on the Download button to choose between the PDF or Google Slides version of this resource.
Print the display and groundhog heads on cardstock for added durability.
Save paper by projecting the chart from your smartboard or another projection device. Work through it as a class by having students record their answers in their writing notebooks. Print this worksheet double-sided.
NEXT: How Does Groundhog Day Work? Plus Activities for Kids
Don’t stop there! Groundhog Day wouldn’t be complete without these activities and teaching resources too:
[resource:3768810] [resource:3811422] [resource:2653566]


0 Comments
Write a review to help other teachers and parents like yourself. If you'd like to request a change to this resource, or report an error, select the corresponding tab above.